


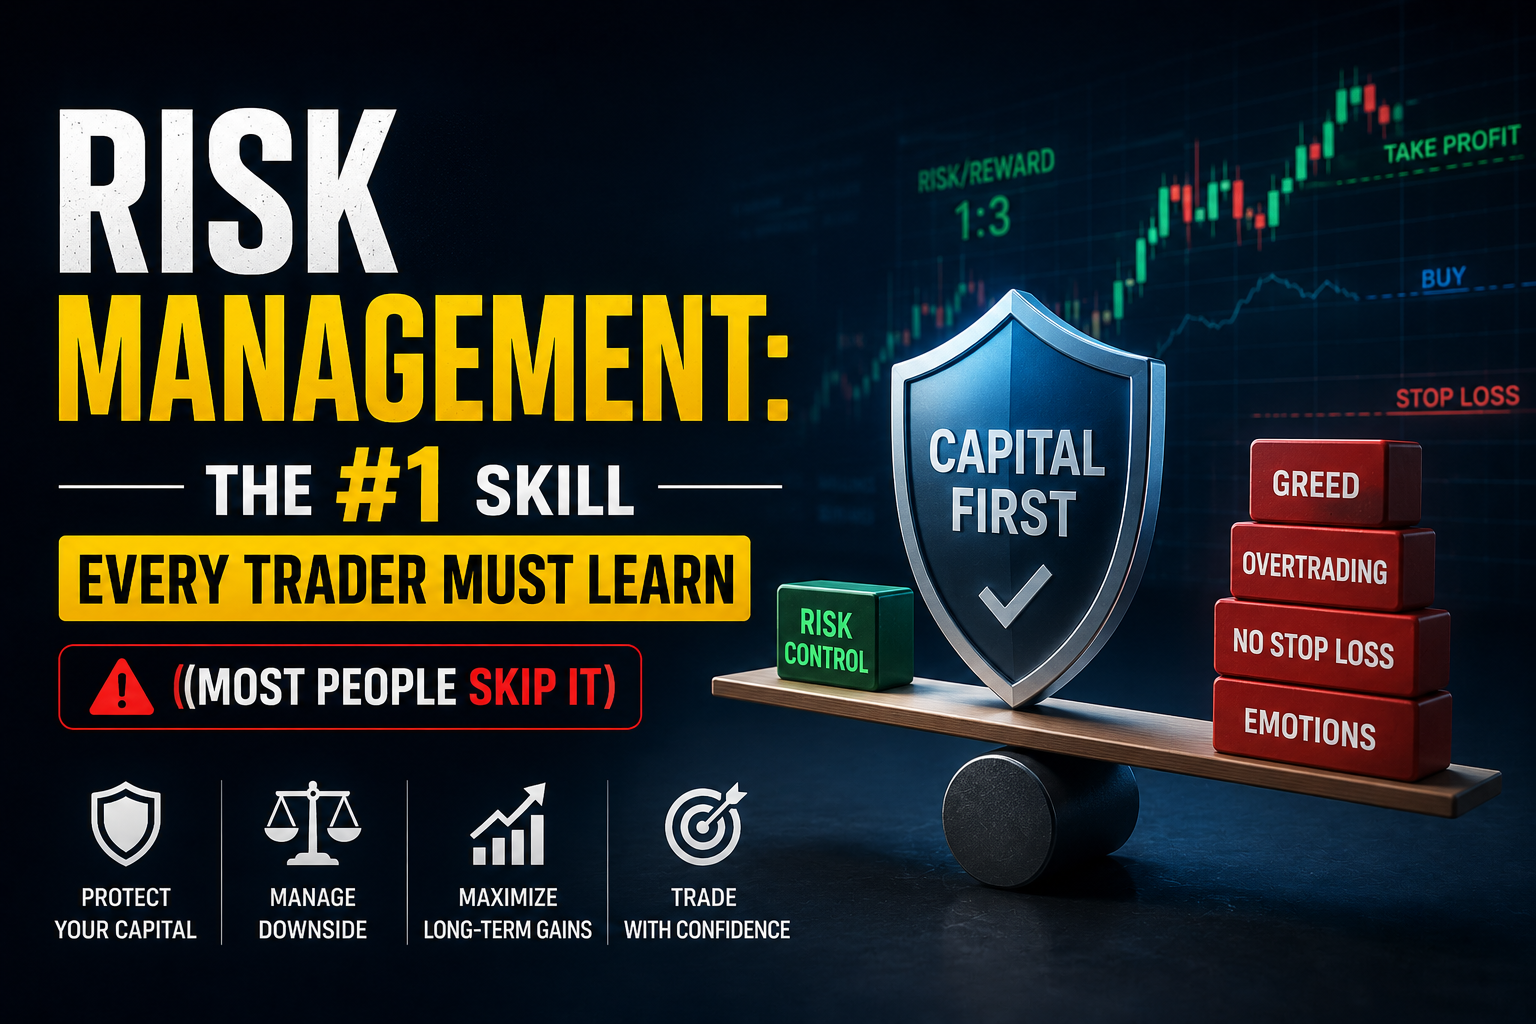
It was a USD/JPY position. I was up 120 pips. I had no take profit set because I thought it was going higher. Then the Bank of Japan made an unscheduled announcement. The pair moved 200 pips against me in under four minutes. I had no stop loss. By the time I reacted, I had given back the 120 pip profit plus an additional 80 pips of losses.
That trade had nothing wrong with the strategy. Everything wrong with the risk management.
I spent the following six months studying risk management with the same intensity I had previously wasted on indicators. This article is everything I learned, organized in the order you need to apply it.
Why Risk Management Is More Important Than Strategy
Here is the uncomfortable truth that most trading courses never state directly: a mediocre strategy with excellent risk management will outperform a brilliant strategy with poor risk management every time, given a large enough sample of trades.
The reason is mathematical. When you lose a large percentage of your account, the amount you need to gain to recover is disproportionately larger. This is the most important table in this article:
| Loss % | Account After | Needed to Break Even | Probability (50% WR) | Recovery Difficulty |
| 10% | $900 | +11.1% | Common | Easy — standard drawdown |
| 25% | $750 | +33.3% | Occasional | Challenging but doable |
| 50% | $500 | +100% | Rare with 1% risk | Requires doubling — very hard |
| 75% | $250 | +300% | Near impossible with 10% | Practically unrecoverable |
Read that table carefully. A 50% drawdown requires 100% gain to recover. A 75% drawdown requires 300%. These are not dramatic scenarios — at 10% risk per trade, a 75% drawdown can occur within 15 losing trades. That is not an unusual losing streak.
This is why the 1% rule exists. At 1% risk per trade, reaching even a 50% drawdown requires an extended period of consecutive losses that would signal a broken strategy long before the account reaches crisis level.
The 7 Rules of Forex Risk Management
These are not suggestions. They are the operating system of every profitable trader I have studied.
RULE 1 — Risk exactly 1–2% of your account per trade — never more
Risk exactly 1–2% of your account per trade — never more
Write this on paper and tape it next to your screen: Maximum risk per trade = 1-2% of current account balance. On a $1,000 account, that is $10-$20 per trade. On a $5,000 account, $50-$100. This number cannot be increased because the setup “looks certain” or because you want to recover a loss faster. The 1-2% rule is non-negotiable precisely because it will feel too conservative when you are tempted to break it.
RULE 2 — Always set your stop loss before you enter — not after
Always set your stop loss before you enter — not after
Your stop loss must be placed when you enter the trade, at a level determined by chart structure (below a support level, above a resistance level, or at the logical point where your trade thesis is proven wrong). Stop losses placed after entry based on how much you are willing to lose emotionally are not stop losses — they are wishful thinking with extra steps.
RULE 3 — Your reward must be at least twice your risk (1:2 minimum R:R)
Your reward must be at least twice your risk (1:2 minimum R:R)
If you are risking 20 pips, your minimum target should be 40 pips. This single rule transforms a 40% win rate strategy from a losing system into a profitable one. Look at the evidence:
| Win Rate | R:R Ratio | 100 Trades | Net Result | Verdict |
| 40% | 1:1 | 40W / 60L | -20R | ❌ Losing — the average beginner |
| 50% | 1:1 | 50W / 50L | Break even | 😐 After spread/fees, actually losing |
| 40% | 1:2 | 40W / 60L | +20R | ✅ Profitable — only right 40% of the time |
| 33% | 1:3 | 33W / 67L | +32R | ✅ Profitable — right only 1 in 3 times! |
The math is clear: win rate is far less important than you think. What matters is the ratio of average win to average loss. A trader who wins 40% of their trades with 1:2 reward-to-risk makes more money than one who wins 60% with 1:1.
RULE 4 — Set a daily loss limit and stop trading when you hit it
Set a daily loss limit and stop trading when you hit it
Professional traders use daily loss limits of 2-5% of account. When that threshold is hit, the trading session ends — regardless of how many setups appear, regardless of the desire to recover. Continuation after a loss limit creates the emotional conditions for revenge trading, which creates deeper losses. The market will be open tomorrow.
RULE 5 — Never add to a losing position
Never add to a losing position
Adding money to a position that is moving against you — “averaging down” or “martingaling” — is the most reliably account-destroying behavior in retail trading. The logic feels sound: the price will eventually come back. It sometimes does. When it does not, the loss is catastrophic. One position that never returns to your entry price can eliminate months of profitable trading.
RULE 6 — Reduce position size after a drawdown period
Reduce position size after a drawdown period
If you experience three consecutive losing trades, reduce your position size by 50% until you have three consecutive profitable trades. This rule prevents a losing streak from spiraling into an account-ending drawdown. The smaller position size also reduces the emotional pressure that compounds losing streaks into trading pattern collapse.
RULE 7 — Never risk money you cannot afford to lose completely
Never risk money you cannot afford to lose completely
This is not legal boilerplate. This is practical psychology. When you trade with money that has another purpose — rent, emergency fund, money borrowed from someone — the emotional weight of each trade becomes disproportionate to its size. That emotional weight destroys execution quality. Trade with capital that you have mentally accepted could go to zero without affecting your life.
Position Sizing: The Formula Every Trader Needs
Position sizing is how you translate the 1% rule into actual lot sizes. Here is the formula:
Lot Size = (Account Balance × Risk %) ÷ (Stop Loss Pips × Pip Value)
Applied examples on EUR/USD where 1 pip = $10 per standard lot:
| Account | Risk % | Risk $ | Stop Loss | Lot Size | Calculation |
|
$1,000 |
1% | $10 | 20 pips | 0.05 lots | $10 ÷ (20 × $10) |
| $1,000 | 1% | $10 | 50 pips | 0.02 lots | $10 ÷ (50 × $10) |
| $5,000 | 1% | $50 | 20 pips | 0.25 lots | $50 ÷ (20 × $10) |
Use a free position size calculator rather than calculating manually for every trade. The Exness calculator, Myfxbook, and dozens of free online tools do this instantly. The critical habit is that position size is calculated before entry, every time, from the correct inputs — not estimated.
Stop Loss Placement: Where the Stop Goes — and Why Location Matters
The most common stop loss mistake is setting it based on dollar amount rather than chart structure. “I can only afford to lose $15, so my stop will be 15 pips.” This approach almost guarantees the stop will be triggered by normal market noise before the trade has time to work.
The correct approach: identify the level on the chart where your trade thesis is definitively wrong, then set the stop there — and calculate your position size to make that distance equal 1-2% of your account.
For a Long (Buy) Trade
The stop goes below the most recent significant support level. If EUR/USD is bouncing off a support at 1.0800, your stop might go at 1.0785 — below the support level and below recent candle lows. If price breaks that level with conviction, the bullish setup is invalidated.
For a Short (Sell) Trade
The stop goes above the most recent significant resistance level. If price is rejecting a resistance at 1.0900, your stop might go at 1.0915 — above the resistance and above recent candle highs.
The candlestick patterns that define key levels are documented in detail in: Read Candlestick Charts Like a Pro.
Building a Trading Journal: Where Risk Management Becomes Real
Risk management rules on paper are worthless without accountability data. A trading journal converts abstract rules into measurable execution metrics.
For every trade, record:
Entry price, stop loss, take profit, position size, R:R ratio
Setup type (what pattern or signal triggered the trade)
Emotional state when entering (calm, anxious, FOMO, revenge-motivated)
Outcome and what you would do differently
Review weekly. Calculate: win rate, average win in R, average loss in R, expectancy [(Win Rate × Avg Win) − (Loss Rate × Avg Loss)]. Positive expectancy confirms your strategy has edge. Negative expectancy means either the strategy or the execution needs to change — and the journal tells you which.
I use Claude AI to analyze my journal entries each week: paste the week’s trades and ask it to identify patterns — are my losses clustered on certain days? After winning streaks? On specific pairs? The AI spots things I cannot see from inside the data.
Risk Management for Bot Trading
If you are using trading bots (Expert Advisors), risk management parameters are set once in the bot configuration rather than applied trade by trade. This makes discipline easier — the bot cannot deviate emotionally — but also means initial configuration errors compound automatically.
For EA risk settings:
Lot size: Set to auto-calculate based on account balance percentage, not fixed lots. Fixed lots do not scale with account growth or protect proportionally during drawdowns.
Risk per trade: 1-1.5% for conservative bots. 2% maximum for bots with verified 6-month track records.
Maximum drawdown: Set a maximum portfolio drawdown (e.g., 15%) at which the bot pauses for manual review. Do not let an EA run indefinitely through a deteriorating market without oversight.
My bot ran at 1.5% risk per trade over 90 days and generated a 44% return. The risk setting was the primary decision that determined sustainability. Full experiment: I Let a Bot Trade My $1,000 Account for 90 Days.
The Psychology Layer: Why Good Rules Get Broken
Understanding risk management intellectually is not the same as applying it consistently under emotional pressure. The rules are simple. The psychology is not.
After a winning streak: confidence becomes overconfidence. Position sizes creep up. Stop losses become “flexible.” The winning streak feels like competence when it may be luck. Apply your rules with the same rigidity after ten consecutive wins as after ten consecutive losses.
After a losing streak: the temptation to increase size to recover faster is strongest at exactly the moment when you should be reducing size. Losing streaks are normal. They indicate nothing about your strategy’s long-term edge. React to them by reducing exposure, not increasing it.
During high-impact news: spreads widen dramatically around news events (FOMC, NFP, central bank decisions). Either close positions before the event or stay out of the market entirely. The potential reward does not justify the execution risk of trading through major news.
For the complete psychology breakdown: Why 90% of Traders Lose (And How to Be the 10%).
Your Risk Management Checklist: Apply Before Every Trade
Use this before every single trade entry, without exception:
□ Have I identified the stop loss level based on chart structure (not dollar amount)?
□ Have I calculated my position size using the 1-2% rule and the chart-based stop distance?
□ Is my reward target at least 2× my risk (minimum 1:2 R:R)?
□ Is my daily loss limit still available? Have I already had too many trades today?
□ Am I entering for a valid setup or because of FOMO/revenge/boredom?
□ Is there a major news event in the next 30 minutes that could spike volatility?
□ Have I set both the stop loss AND take profit in the platform before confirming entry?
Opening a Well-Regulated Account for Implementing These Rules
Risk management only works if your broker does not work against you. Spreads, execution speed, and stop loss processing all affect how your risk rules play out in real conditions.
My primary broker: Exness — code: kfmuhfhs0m. Raw spreads from 0.0 pips, instant withdrawals, full stop loss support, negative balance protection. $10 minimum deposit.
Secondary option: Vantage — code: ayQVh5rp. ASIC + FCA regulated, 1,000+ instruments, TradingView integration.
Related Articles
Forex fundamentals: Forex Trading for Complete Beginners: 2026 Guide
Psychology of losing: Why 90% of Traders Lose and How to Be the 10%
Candlestick patterns: Read Candlestick Charts Like a Pro
Copy trading: Copy Trading for Beginners: Complete 2026 Guide
Bot trading evidence: I Let a Bot Trade My $1,000 Account for 90 Days
Risk Warning: Forex trading involves substantial risk of loss. This article is for educational purposes only and does not constitute financial advice. Never trade with money you cannot afford to lose.
© 2026 MMOIncome.com
