


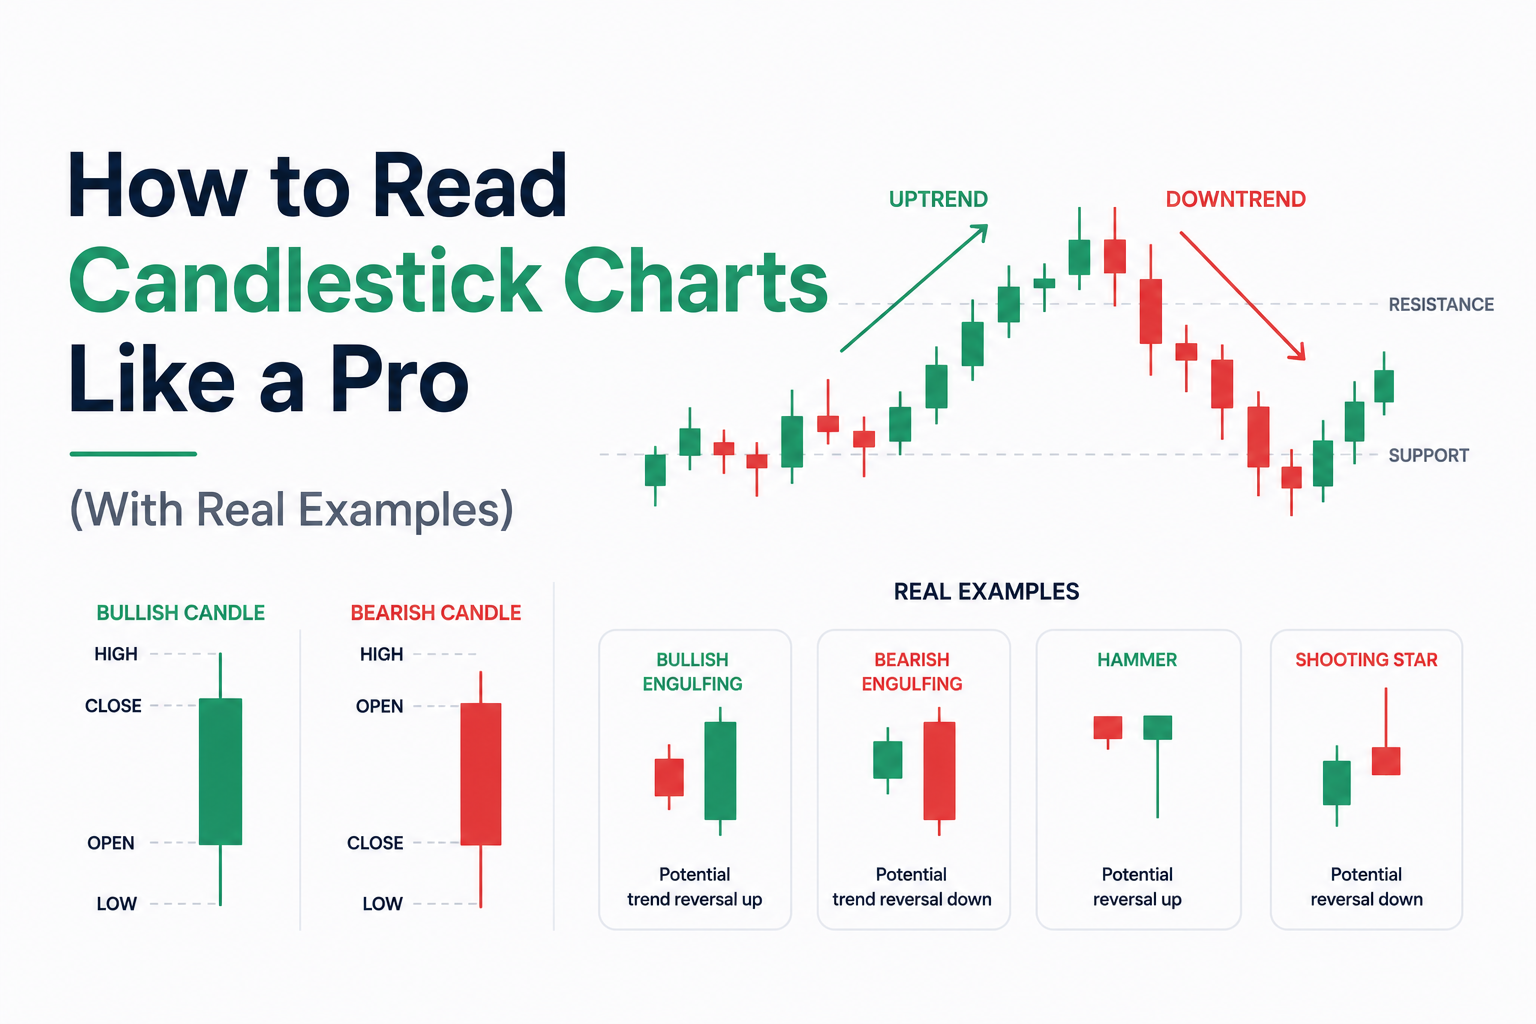
Candlestick charts are the language the market speaks. Every price movement, every battle between buyers and sellers, every moment of indecision and conviction — all of it is encoded in a series of colored bars on your screen.
Most beginners look at candlestick charts and see random colored noise. Experienced traders look at the same chart and read a story: where institutional money entered, where retail traders got trapped, where the next move is likely to go.
I spent three months studying candlestick patterns before I understood why they work. Then I spent six more months learning that patterns alone are not enough — context is everything. This guide gives you both: the patterns and the context that makes them actionable.
Important note: Candlestick analysis is a tool, not a crystal ball. No pattern is 100% reliable. The patterns in this guide work best when combined with support/resistance levels, trend direction, and volume. You will understand exactly how to combine them by the end of this article.
All 11 Patterns at a Glance
Here is the complete pattern reference before we go deep on each one. Bookmark this table.
| Pattern | Type | Signal | Reliability | Best Timeframe |
| Doji | Single | Indecision | Medium ⭐⭐⭐ | H4 and above |
| Hammer | Single | Bullish Reversal | High ⭐⭐⭐⭐ | H1, H4, Daily |
| Shooting Star | Single | Bearish Reversal | High ⭐⭐⭐⭐ | H1, H4, Daily |
| Bullish Engulfing | Double | Bullish Reversal | Very High ⭐⭐⭐⭐⭐ | H4, Daily, Weekly |
| Bearish Engulfing | Double | Bearish Reversal | Very High ⭐⭐⭐⭐⭐ | H4, Daily, Weekly |
| Morning Star | Triple | Bullish Reversal | Very High ⭐⭐⭐⭐⭐ | Daily, Weekly |
| Evening Star | Triple | Bearish Reversal | Very High ⭐⭐⭐⭐⭐ | Daily, Weekly |
| Marubozu | Single | Strong Continuation | High ⭐⭐⭐⭐ | Any |
| Harami | Double | Reversal Warning | Medium ⭐⭐⭐ | H4, Daily |
| 3 White Soldiers | Triple | Strong Bullish | Very High ⭐⭐⭐⭐⭐ | Daily, Weekly |
| 3 Black Crows | Triple | Strong Bearish | Very High ⭐⭐⭐⭐⭐ | Daily, Weekly |
Reliability key: ⭐⭐ = low / ⭐⭐⭐ = medium / ⭐⭐⭐⭐ = high / ⭐⭐⭐⭐⭐ = very high. Ratings are based on academic research and personal trading experience across thousands of trades.
Anatomy of a Candlestick: Reading the Story
Before any pattern makes sense, you need to understand what each part of a single candlestick communicates. Every candle tells you exactly four things: the open, the high, the low, and the close — and the relationship between them tells you who won the battle during that time period.
| Part | Name | What It Tells You |
| Top vertical line | Upper Shadow / Wick | Highest price reached during the candle period |
| Colored rectangle (top) | Close Price | Green/White candle: where price closed (upper end of body) |
| Colored rectangle (body) | Real Body | Difference between open and close — bigger body = stronger conviction |
| Colored rectangle (bottom) | Open Price | Green/White: open is lower. Red/Black: open is higher |
| Bottom vertical line | Lower Shadow / Wick | Lowest price reached during the candle period |
| Green / White body | Bullish Candle | Close > Open — buyers won this period |
| Red / Black body | Bearish Candle | Close < Open — sellers won this period |
The size of the body relative to the wicks is the most important relationship to understand. A large body with small wicks = strong conviction in one direction. A small body with large wicks = indecision — buyers and sellers fought hard but neither won decisively.
💡 Pro Tip: The color of the candle is less important than the size and position of the shadows. A red candle with a tiny body and huge lower shadow shows rejection of lower prices — buyers stepped in aggressively. That is bullish information regardless of the candle color.
Part 1: Single Candlestick Patterns
Single candlestick patterns deliver a complete message from one candle alone. These are the fastest signals to identify — one glance tells you whether buyers or sellers are in control.
PATTERN 1 SINGLE CANDLE Reliability: High ⭐⭐⭐⭐
Marubozu — The Conviction Candle
The Marubozu is the clearest candlestick on any chart. It has virtually no shadows — just a large, clean body. This candle says one thing loudly: one side completely dominated from open to close.
A bullish Marubozu opened at the low and closed at the high. Buyers controlled the entire session without allowing sellers even a brief moment of control. A bearish Marubozu is the opposite — sellers dominated start to finish.
BULLISH MARUBOZU:
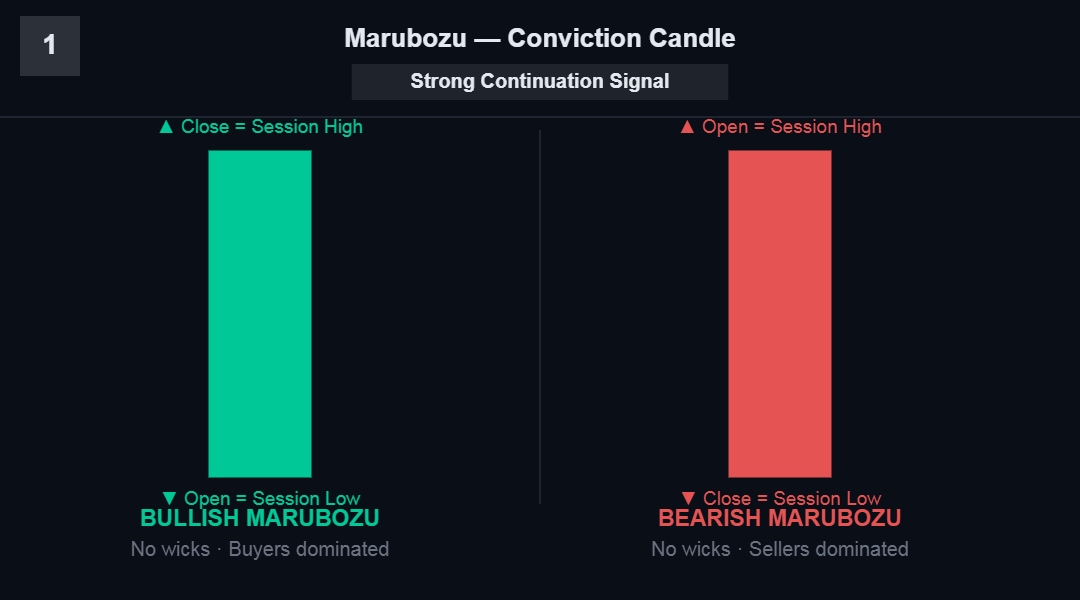
Pattern: Bearish Marubozu | Signal: Bearish Continuation
How to Trade the Marubozu
The Marubozu is most powerful after a period of indecision or consolidation. When a strong breakout happens on a Marubozu candle, it often signals the beginning of a new directional move.
📐 Trade Setup:
Entry: Next candle open after Marubozu closes
Stop Loss: Below the Marubozu low (bullish) / Above the Marubozu high (bearish)
Target: Minimum 2:1 reward-to-risk from entry
Note: Most reliable on H4 and Daily timeframes. On lower timeframes, confirm with volume surge.
💡 Pro Tip: A Bullish Marubozu after a downtrend is one of the strongest reversal signals available. Combine with a key support level for maximum reliability.
PATTERN 2 SINGLE CANDLE Reliability: Medium ⭐⭐⭐
Doji — The Indecision Candle
The Doji is one of the most misunderstood patterns in trading. Beginners see it as a signal to trade. Experienced traders see it as context — a warning that the current trend may be losing momentum.
A Doji forms when the open and close are at the same price (or very close). The market opened, moved in both directions, but ultimately returned exactly where it started. Neither buyers nor sellers won. That stalemate has meaning only in context.
FOUR TYPES OF DOJI:
Standard Doji Long-Legged Doji Dragonfly Doji Gravestone Doji
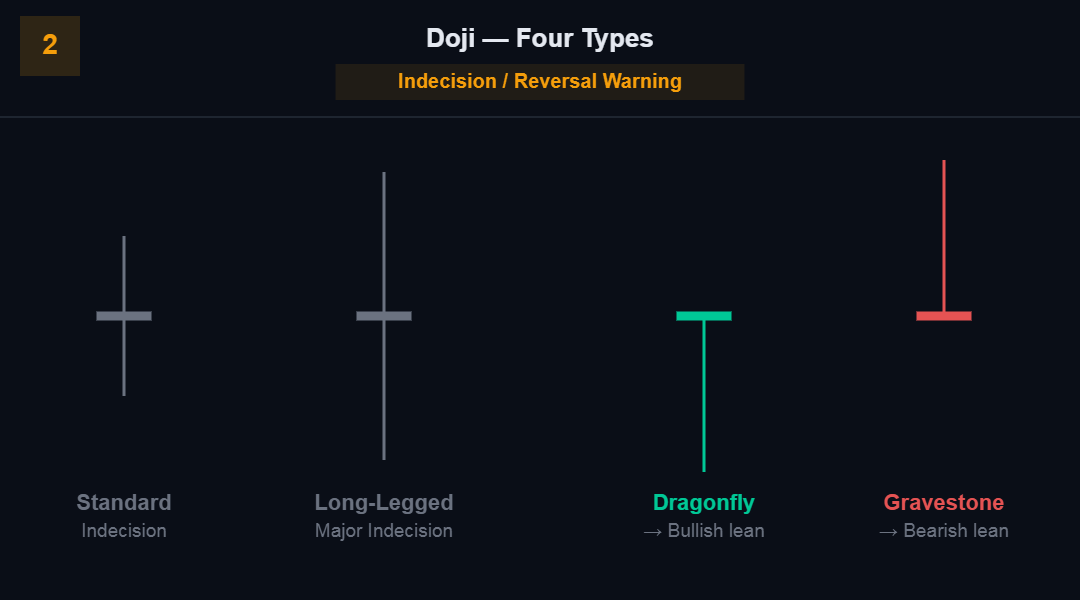
Equal open/close Wide range, no close Long lower wick Long upper wick
= Indecision = Major indecision = Bullish lean = Bearish lean
The Doji Context Rule
A Doji in the middle of a trend means nothing. A Doji at a key support level after a downtrend, or at a key resistance level after an uptrend — that is significant. The location of the Doji determines its importance.
Dragonfly Doji — bullish, especially at support. Sellers drove price down, buyers took over and pushed it all the way back to the open.
Gravestone Doji — bearish, especially at resistance. Buyers drove price up, sellers overwhelmed them and pushed it back to the open.
💡 Pro Tip: Never trade a standard Doji alone. Always combine with a key level and at least one confirming factor (volume spike, strong preceding trend, major support/resistance zone).
PATTERN 3 SINGLE CANDLE Reliability: High ⭐⭐⭐⭐
Hammer — The Bullish Reversal
The Hammer is the candlestick pattern I use most frequently in my own trading. It forms at the bottom of a downtrend and signals that sellers tried to push price lower but failed decisively — buyers stepped in and drove price back up. The long lower shadow is the visual evidence of that seller failure.
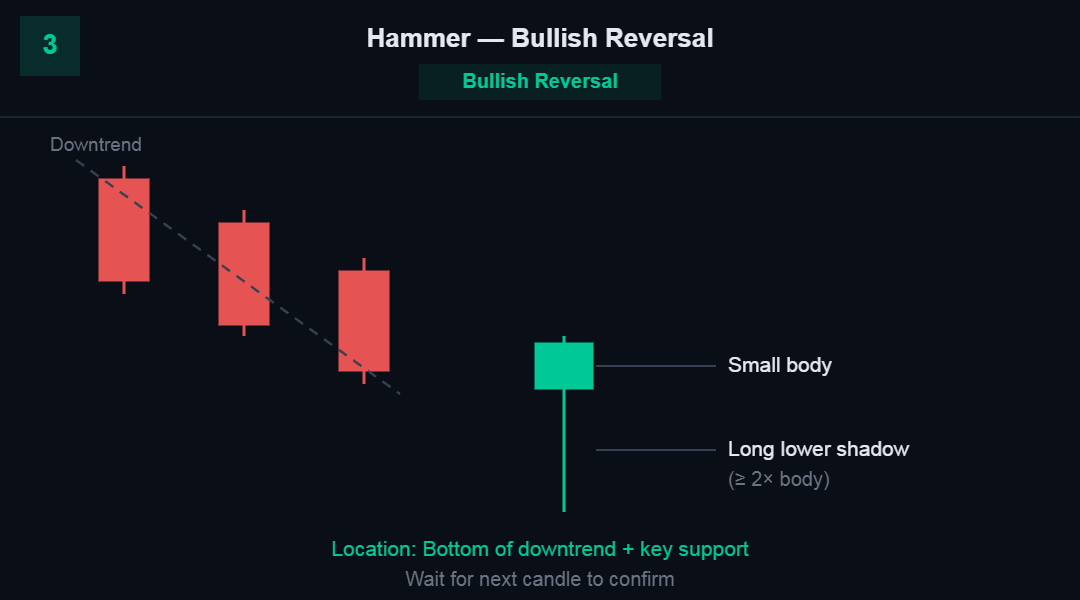
LOCATION: Bottom of downtrend + key support = Strong signal
Pattern: Hammer | Signal: Bullish Reversal
The Three Hammer Rules
Rule 1: The lower shadow must be at least 2x the length of the body. A small lower shadow is not a Hammer.
Rule 2: The candle must appear after a downtrend of at least 3-5 candles. A Hammer in sideways market has no reversal context.
Rule 3: Wait for confirmation — the next candle should close higher. Do not enter on the Hammer candle while it is still forming.
📐 Trade Setup:
Entry: Next candle open above Hammer close, or on break of Hammer high
Stop Loss: Below the Hammer’s low (the lowest point of the lower shadow)
Target: Previous resistance level or 2:1 R:R minimum
Note: Green Hammer (body) is stronger than red. Location at major support doubles reliability.
PATTERN 4 SINGLE CANDLE Reliability: High ⭐⭐⭐⭐
Shooting Star — The Bearish Reversal
The Shooting Star is the exact mirror of the Hammer. It forms at the top of an uptrend and shows that buyers tried to push price higher but failed — sellers took over and drove price back down. The long upper shadow is the visual evidence of buyer failure.
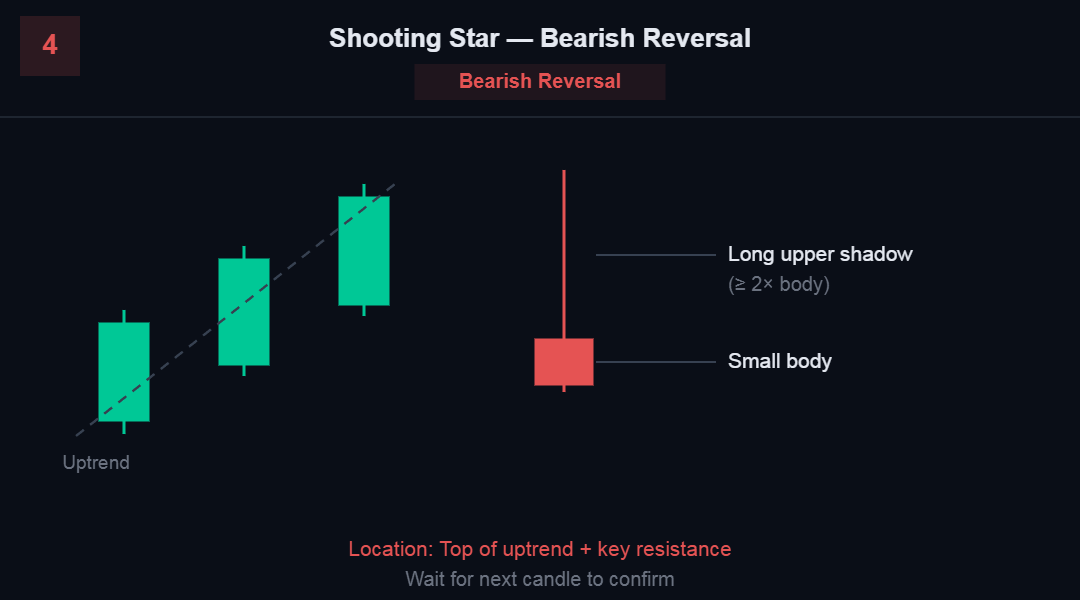
LOCATION: Top of uptrend + key resistance = Strong signal
Pattern: Shooting Star | Signal: Bearish Reversal
📐 Trade Setup:
Entry: Next candle open below Shooting Star close, or on break of Shooting Star low
Stop Loss: Above the Shooting Star’s high (the tip of the upper shadow)
Target: Previous support level or 2:1 R:R minimum
Note: Red Shooting Star (body) is stronger than green. At major resistance after extended uptrend = high-probability trade.
💡 Pro Tip: The Shooting Star and Hammer are mirror images. The key identification rule: Hammer has a long bottom shadow, appears at bottoms. Shooting Star has a long top shadow, appears at tops.
PATTERN 5 SINGLE CANDLE Reliability: Medium ⭐⭐⭐
Spinning Top — Indecision at Extremes
The Spinning Top has a small body with shadows of roughly equal length on both sides. It shows that both buyers and sellers fought but neither gained clear control. Like the Doji, context determines meaning.
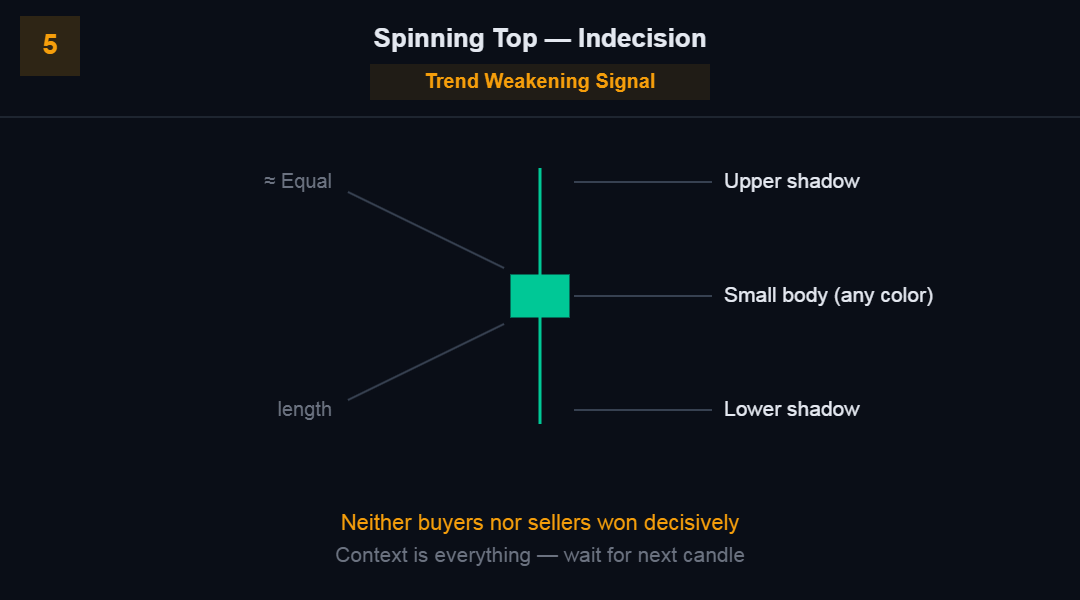 Both sides fought — neither won clearly.
Pattern: Spinning Top | Signal: Indecision — Trend Weakening
A Spinning Top at the top of a trend signals that bullish momentum is fading. At the bottom, it signals bearish momentum is fading. Either way, wait for the next candle to confirm direction before trading.
Part 2: Double Candlestick Patterns
Two-candle patterns require two consecutive candles to form the signal. They are generally more reliable than single-candle patterns because they show a direct battle between two consecutive sessions.
PATTERN 6 DOUBLE CANDLE Reliability: Very High ⭐⭐⭐⭐⭐
Bullish Engulfing — Momentum Flip
The Bullish Engulfing is one of the most powerful reversal signals in technical analysis. It forms when a red (bearish) candle is completely engulfed by the following green (bullish) candle — meaning the green candle’s body opens below the red candle’s close and closes above the red candle’s open.
DAY 1 (Red) DAY 2 (Green)
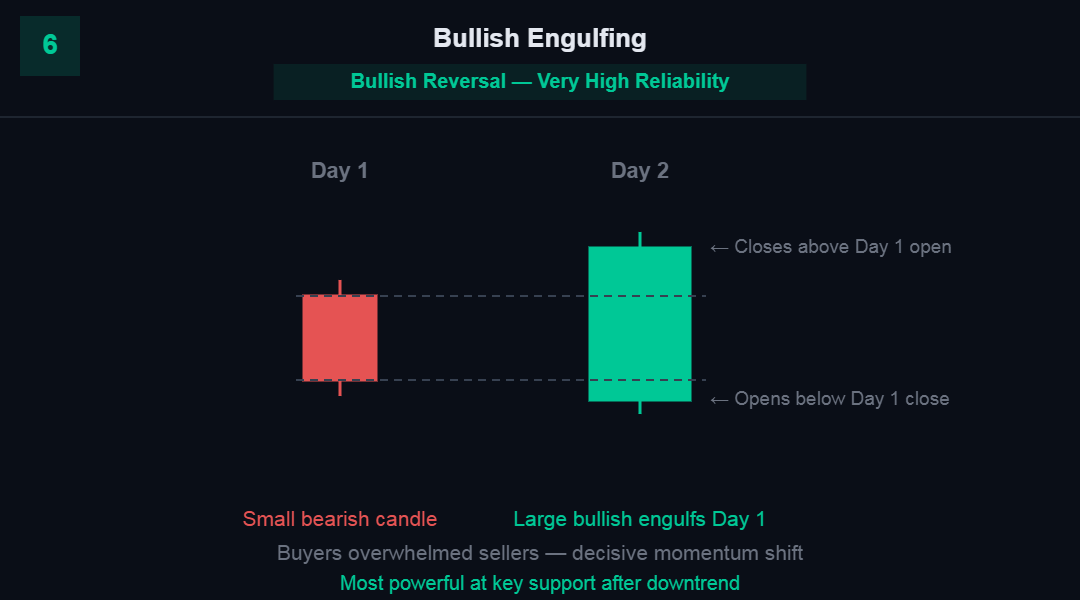
Sellers dominated. Buyers took over completely.
Green body is WIDER than red body = valid engulfing
Pattern: Bullish Engulfing | Signal: Bullish Reversal
What the Bullish Engulfing Tells You
Day 1: Sellers push price down. Bears are in control. Day 2: Buyers not only reverse the entire previous day’s loss, they exceed it. The complete swallowing of the previous candle shows a dramatic, decisive shift in momentum. Institutional money entering the market creates candles like this.
📐 Trade Setup:
Entry: Open of candle after the engulfing pattern closes
Stop Loss: Below the low of the entire engulfing pattern (Day 1 low)
Target: Nearest resistance level or 2:1 R:R minimum
Note: Most powerful at major support zones after extended downtrends. Larger the engulfing candle relative to Day 1, stronger the signal.
PATTERN 7 DOUBLE CANDLE Reliability: Very High ⭐⭐⭐⭐⭐
Bearish Engulfing — Selling Takes Over
The Bearish Engulfing is the mirror image of the Bullish Engulfing. A green candle is completely swallowed by the following red candle, showing that sellers have overwhelmed buyers decisively.
DAY 1 (Green) DAY 2 (Red)
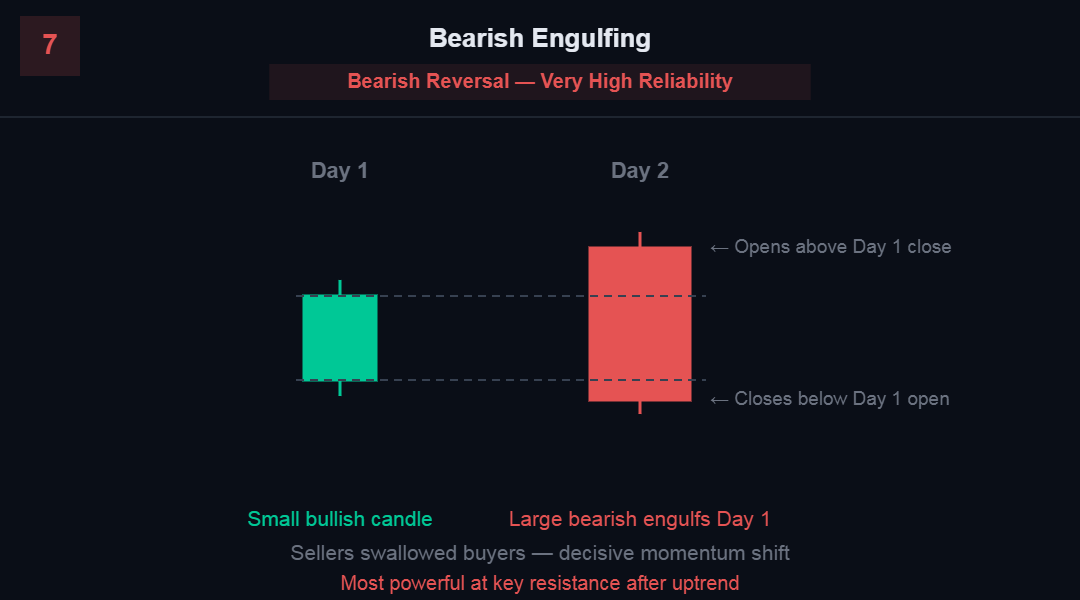
Buyers pushed up. Sellers swallowed it all and more.
Pattern: Bearish Engulfing | Signal: Bearish Reversal
📐 Trade Setup:
Entry: Open of candle after the bearish engulfing pattern closes
Stop Loss: Above the high of the entire pattern (Day 1 high)
Target: Nearest support level or 2:1 R:R minimum
Note: Most powerful at major resistance zones after extended uptrends. Works on all timeframes but most reliable on H4 and above.
💡 Pro Tip: The engulfing pattern is my #1 reversal signal. I only trade it at major support/resistance levels on the H4 or Daily chart. On the 5-minute chart, engulfing patterns appear constantly and have no statistical edge.
PATTERN 8 DOUBLE CANDLE Reliability: Medium ⭐⭐⭐
Harami — The Inside Bar Reversal
Harami means ‘pregnant’ in Japanese — and the pattern looks like it. A large candle is followed by a small candle whose entire body fits inside the previous candle’s body. This shows that the momentum of the large candle has stalled.
BULLISH HARAMI: BEARISH HARAMI:
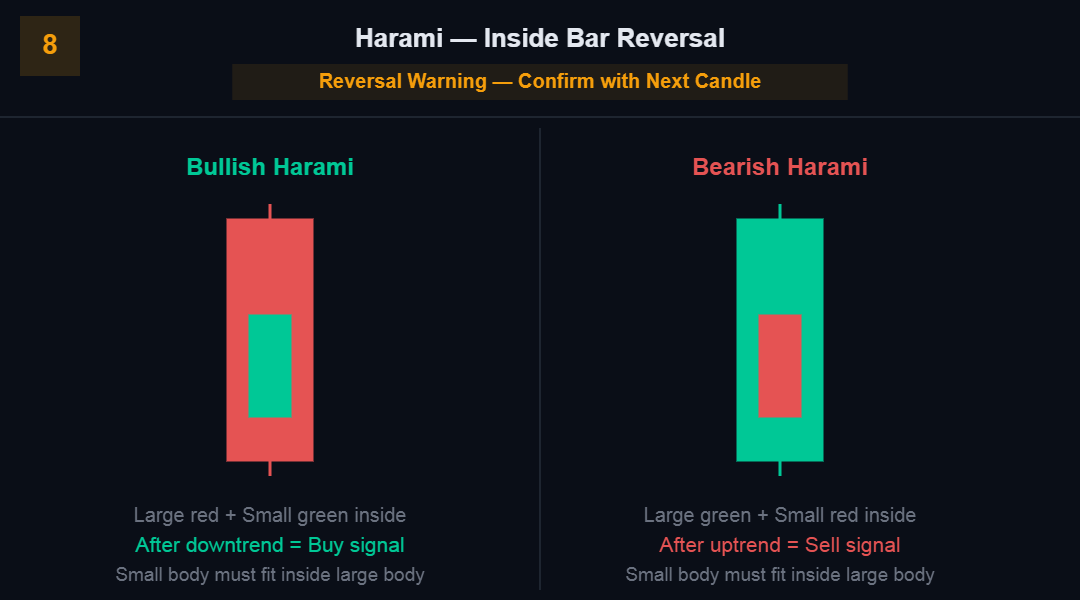
After uptrend: reversal signal
Pattern: Harami | Signal: Reversal Warning — Wait for Confirmation
The Harami is a warning, not a command. Wait for the third candle to confirm direction before entering. A bullish Harami followed by a strong green candle = high probability long entry.
Part 3: Triple Candlestick Patterns
Three-candle patterns are the most reliable signals in candlestick analysis. They require a full narrative arc: move, pause, reversal. That three-act structure makes them highly trustworthy.
PATTERN 9 TRIPLE CANDLE Reliability: Very High ⭐⭐⭐⭐⭐
Morning Star — Dawn After the Fall
The Morning Star is the most powerful bullish reversal pattern in candlestick analysis. It tells the complete story of a trend reversal in three candles: the final bearish push, a moment of indecision, and a decisive bullish recapture.
DAY 1 DAY 2 DAY 3
(Large Red) (Small/Doji) (Large Green)
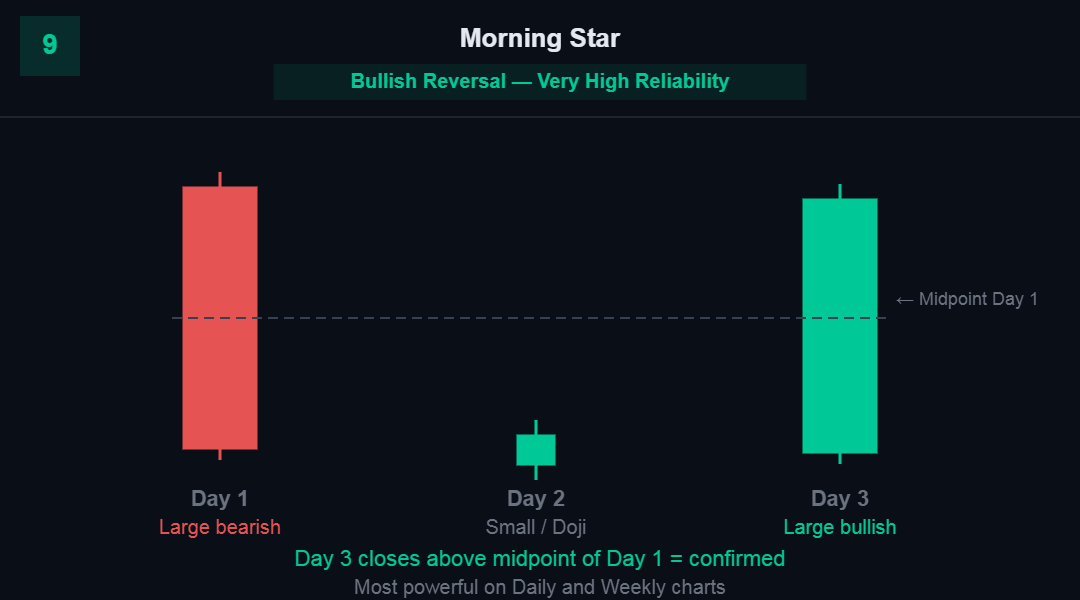
DAY 3 closes above the midpoint of DAY 1 = Confirmed signalPattern: Morning Star | Signal: Bullish Reversal — High Reliability
Morning Star Requirements
Requirement 1: Day 1 is a large bearish candle in a downtrend.
Requirement 2: Day 2 is a small-bodied candle (or Doji) that gaps away from Day 1’s close. The gap is the ‘star.’
Requirement 3: Day 3 is a large bullish candle that closes above the midpoint of Day 1’s body.
📐 Trade Setup:
Entry: Open of the candle following Day 3 (confirmation approach) or aggressive: open of Day 3
Stop Loss: Below the Day 2 low (the low of the star candle)
Target: Previous resistance zone or 3:1 R:R
Note: Most powerful on Daily and Weekly charts. The bigger the Day 3 candle, the stronger the signal.
PATTERN 10 TRIPLE CANDLE Reliability: Very High ⭐⭐⭐⭐⭐
Evening Star — Before the Fall
The Evening Star is the bearish counterpart to the Morning Star. It forms at the top of an uptrend and signals a high-probability reversal to the downside.
DAY 1 DAY 2 DAY 3
(Large Green) (Small/Doji) (Large Red)
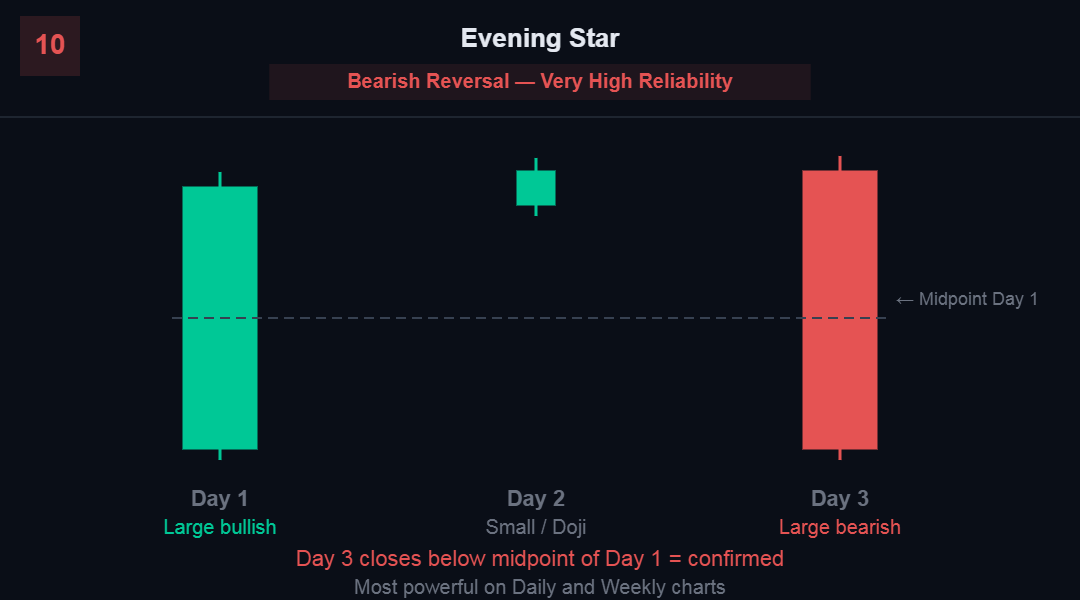
DAY 3 closes below midpoint of DAY 1 = Confirmed signal
Pattern: Evening Star | Signal: Bearish Reversal — High Reliability
📐 Trade Setup:
Entry: Open of candle following Day 3 close (conservative) or open of Day 3 (aggressive)
Stop Loss: Above the Day 2 high (the high of the star candle)
Target: Previous support zone or 3:1 R:R
Note: On Daily timeframe after 10+ candle uptrend at major resistance = one of the highest-probability setups in forex.
PATTERN 11 TRIPLE CANDLE Reliability: Very High ⭐⭐⭐⭐⭐
Three White Soldiers & Three Black Crows
These patterns are less about reversal and more about powerful continuation of momentum. Three consecutive large candles in the same direction with each closing progressively higher (soldiers) or lower (crows) tells you institutional money is accumulating or distributing systematically.
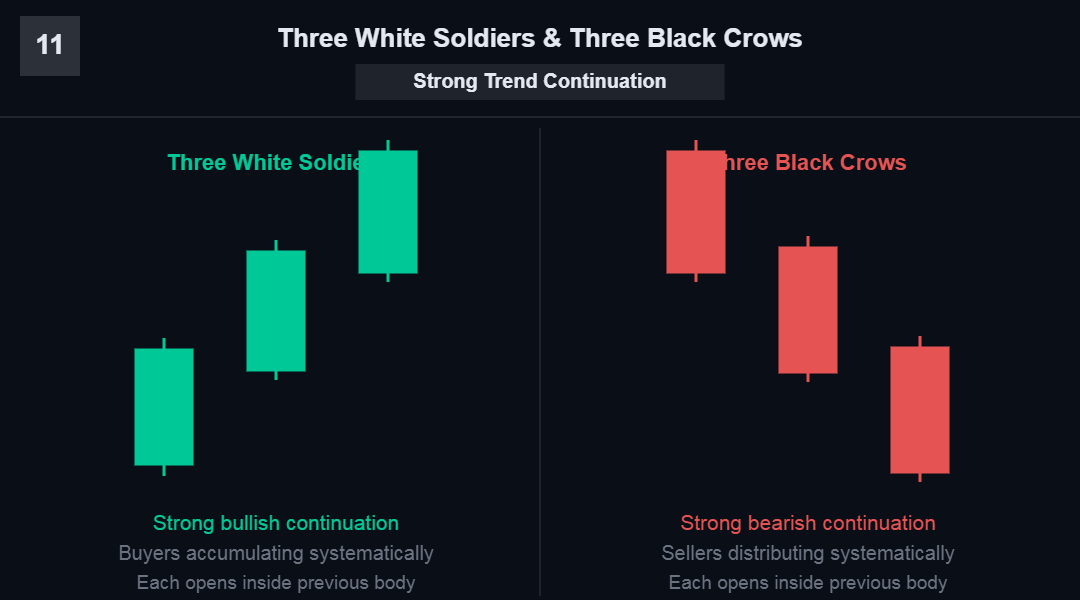
THREE WHITE SOLDIERS: THREE BLACK CROWS:
Pattern: Three Soldiers / Three Crows | Signal: Strong Continuation Signal
Three White Soldiers: After a downtrend or consolidation, three consecutive large bullish candles signal major buyer conviction. This often marks the beginning of a significant trend move.
Three Black Crows: After an uptrend, three consecutive large bearish candles show systematic seller control. This is one of the strongest bearish signals in technical analysis.
💡 Pro Tip: Three White Soldiers appearing after a multi-month downtrend is one of the highest-probability trend change signals available. I have used this exact setup multiple times documented in my bot trading experiments.
How to Combine Candlesticks With Other Analysis
This is the section that separates readers who understand patterns from traders who actually profit from them. A candlestick pattern alone is a clue. Combined with the right context, it is a high-probability trade signal.
The Three-Layer Confirmation Method
Before entering any candlestick-based trade, I require three confirmations:
Layer 1 — Trend Direction: Is the pattern aligned with the higher timeframe trend? Bullish patterns in an uptrend. Bearish patterns in a downtrend. Counter-trend trades have lower probability.
Layer 2 — Key Level: Is the pattern forming at a significant support or resistance level? A Hammer at random market is noise. A Hammer at a 6-month support level is a signal. Learn to draw support and resistance before mastering candlesticks.
Layer 3 — Confirmation Candle: Has the next candle confirmed the direction? Never enter on the pattern candle while it is still forming. Wait for the candle to close, then use the next candle’s behavior as confirmation.
Example (real trade logic): EUR/USD in a confirmed uptrend. Price pulls back to a major support level (the previous month’s high). A Bullish Engulfing forms on the H4 chart at that level. Next H4 candle opens higher. All three layers confirmed. Enter long with stop below the Engulfing pattern low.
This is the framework that powers my manual trading decisions and informs the rules I program into my trading bots. For more on how bots use technical logic, see: Trading Bots Explained: How They Work.
6 Mistakes Every Beginner Makes With Candlestick Patterns
These are the errors I see traders repeat over and over. Understanding them now saves you the expensive education of learning them with real money.
| Mistake | Why It Happens | The Fix |
| Trading every pattern you see | Beginner excitement — seeing patterns everywhere | Only trade patterns at key support/resistance levels |
| Using candles without context | Focusing only on the pattern, not where it appears | Trend + S/R + candle pattern = valid setup |
| Entering before candle closes | Fear of missing the move | Always wait for candle close confirmation |
| Ignoring the overall trend | Pattern tunnel vision | Bullish patterns only in uptrends, bearish in downtrends |
| No stop loss defined | Optimism bias — “this pattern always works” | Stop goes below pattern low (bullish) or above high (bearish) |
| Ignoring timeframe | Trading M5 candles with Daily pattern logic | H4 and above for reliable candlestick signals |
The single biggest improvement you can make to your candlestick trading: always draw your key support and resistance levels before looking for patterns. The levels come first. The patterns confirm the significance of those levels. Not the other way around.
Your Practical Candlestick Trading Workflow
Here is exactly how I use candlestick analysis in my daily trading process:
Step 1 (Weekly, Sunday): Draw major support and resistance levels on Daily and Weekly charts. Mark the zones I will watch for the coming week.
Step 2 (Daily): Check H4 charts on my watchlist pairs. Are any patterns forming at my pre-drawn levels? If yes, move to H1 for entry timing.
Step 3 (At signal): Three-layer check: trend aligned? key level? pattern at that level? If yes to all three, wait for the candle to close.
Step 4 (After candle close): Confirmation candle check. Does the next candle support the signal? Set entry, stop, and target before executing.
Step 5 (After entry): Do not watch the trade. The analysis is done. Trust the plan. Review at end of day.
To practice this workflow without risking real money: open a free demo account with Exness (referral code: kfmuhfhs0m) and practice identifying these patterns in the live market for 30 days before going live. No cost, no risk, full market conditions.
Frequently Asked Questions
Which candlestick patterns are most reliable?
Based on academic research and personal trading experience: Bullish/Bearish Engulfing, Morning/Evening Star, and Three White Soldiers/Three Black Crows have the highest statistical reliability. They work best on H4 timeframe and above at key support/resistance levels.
Do candlestick patterns work on crypto and stocks, or only forex?
Candlestick patterns work on all liquid markets — forex, stocks, crypto, commodities, and indices. The patterns represent human psychology, which is universal across all markets. They are most reliable on high-liquidity instruments where institutional money is active.
What is the best timeframe for candlestick analysis?
H4 (4-hour) and Daily charts provide the most reliable signals. On M5 and M15, patterns appear constantly and have low statistical significance due to market noise. Start your candlestick practice on the Daily chart and add H4 once you are comfortable.
Should I use candlestick patterns for bot trading?
Yes, and many successful bots incorporate candlestick pattern recognition as entry criteria. In my 90-day bot experiment documented in I Let a Bot Trade My $1,000 Account for 90 Days, the bot used a combination of moving average signals and specific candlestick confirmation criteria. That combination produced a 60.3% win rate over 253 trades.
How long does it take to become proficient at reading candlestick charts?
Pattern recognition: 2-4 weeks of daily chart review. Using patterns profitably in context: 3-6 months of demo trading and journaling. Consistently applying the three-layer confirmation method: a lifelong practice that improves with every trade.
Related Articles From MMOIncome
Put your candlestick knowledge into practice with these resources:
Why traders lose: Why 90% of Traders Lose (And How to Be the 10%)
Automation: Trading Bots Explained: How They Work & Which to Choose
Bot experiment: I Let a Bot Trade My $1,000 Account for 90 Days
Bot vs manual: Manual vs. Bot Trading: Real Numbers After 6 Months
Copy trading: Copy Trading for Beginners: Complete 2026 Guide
Broker choice: How to Choose a Forex Broker: 9 Must-Check Things
AI tools for traders: Best Free AI Tools for Traders & Entrepreneurs
Join the MMOIncome Community
Share your candlestick chart analysis and get feedback from active traders:
📘 Facebook Fanpage: facebook.com/mmoincomes
👥 Facebook Group: Join MMOIncome Community — Post your chart analysis and get community feedback from 2,400+ members.
🎬 YouTube: youtube.com/@mmoincome — Watch live chart reading sessions and pattern identification walkthroughs.
Start Practicing Today
You now know 11 of the most powerful candlestick patterns used by professional traders. You understand the anatomy of each pattern, the context that makes it meaningful, and the specific entry, stop, and target rules for trading each one.
The next step is practice. Not simulation. Real markets, real time.
Open a free demo account: Exness (code: kfmuhfhs0m) gives you a demo account with live market prices. Spend 30 days finding and marking every pattern from this guide on the H4 chart. Keep a log of every pattern you identify and what happened next. That journal will teach you more than any course.
Add a second platform: Vantage (code: ayQVh5rp) has native TradingView integration — the clearest charting environment for spotting candlestick patterns. The visual quality of TradingView makes pattern identification significantly easier than MT4/MT5.
Charts are not random noise. They are a conversation between buyers and sellers — and now you know how to listen.
Risk Warning: Candlestick patterns are tools for probability analysis, not guarantees of future price movement. All trading involves substantial risk of loss. Never trade with money you cannot afford to lose. Past pattern performance is not indicative of future results. This content is for educational purposes only and does not constitute financial advice.
© 2026 MMOIncome.com — Smart Money. Smart Systems. Real Income.
